A Power BI dashboard for Blinkit's quick-commerce operations
Blinkit runs on 10-minute grocery delivery, and a business like that generates a lot of operational data fast: orders, delivery timings, inventory movement, customer feedback, marketing spend. The question this project answers is what a manager would actually want to see across all of that: how much revenue is coming in, whether deliveries are on time, which categories are profitable, and whether customers come back.
The code and report file are on GitHub.
What I built
A four-page Power BI report on top of a 9-table Blinkit dataset from Kaggle (synthetic, built for portfolio use): 5,000 orders, 2,500 customers, 268 products, spanning March 2023 to November 2024, about 120,000 rows in total.
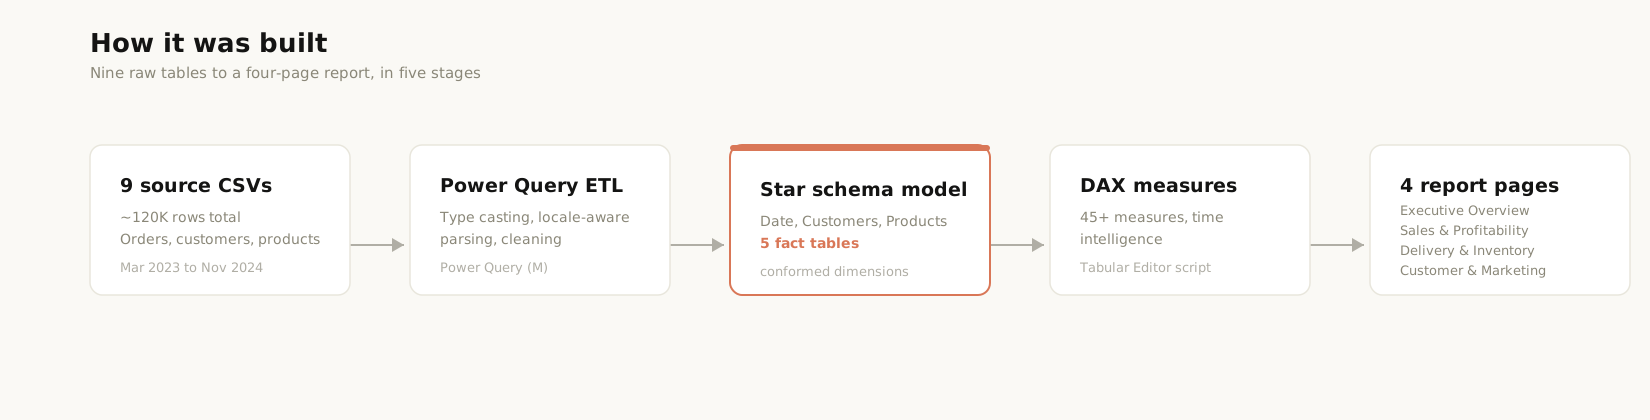
The nine source tables get cleaned and type-cast in Power Query, then modeled into a star schema: three conformed dimensions (Date, Customers, Products) and five fact tables (Orders, Delivery Performance, Inventory, Customer Feedback, Marketing Performance). On top of that sit 45 or so DAX measures, written and managed through Tabular Editor rather than one at a time in the Power BI UI, and a custom theme file in Blinkit's brand green.
The four pages
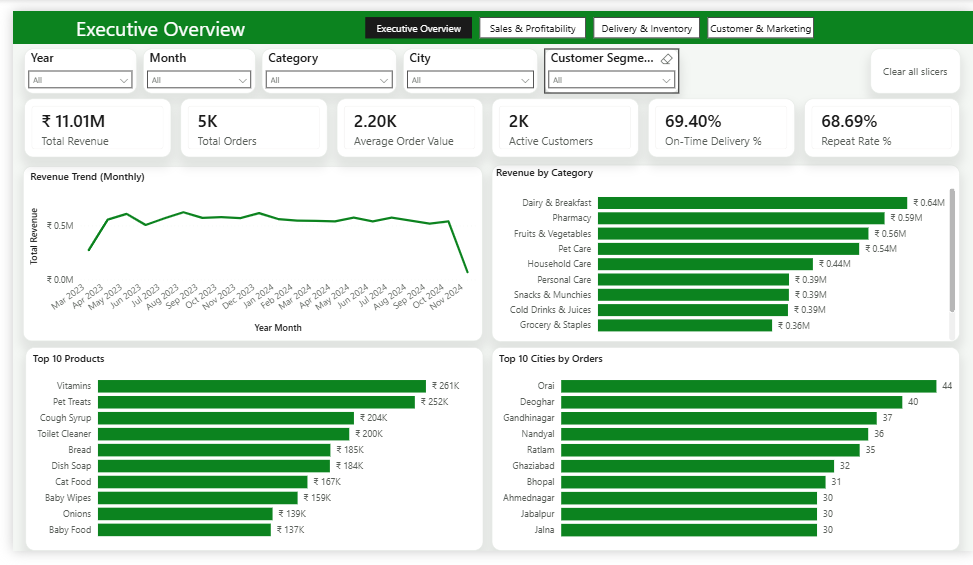
Executive Overview. Six headline KPIs (revenue, orders, average order value, customers, on-time delivery percentage, repeat rate), a revenue trend, category splits, and the top 10 products and cities.
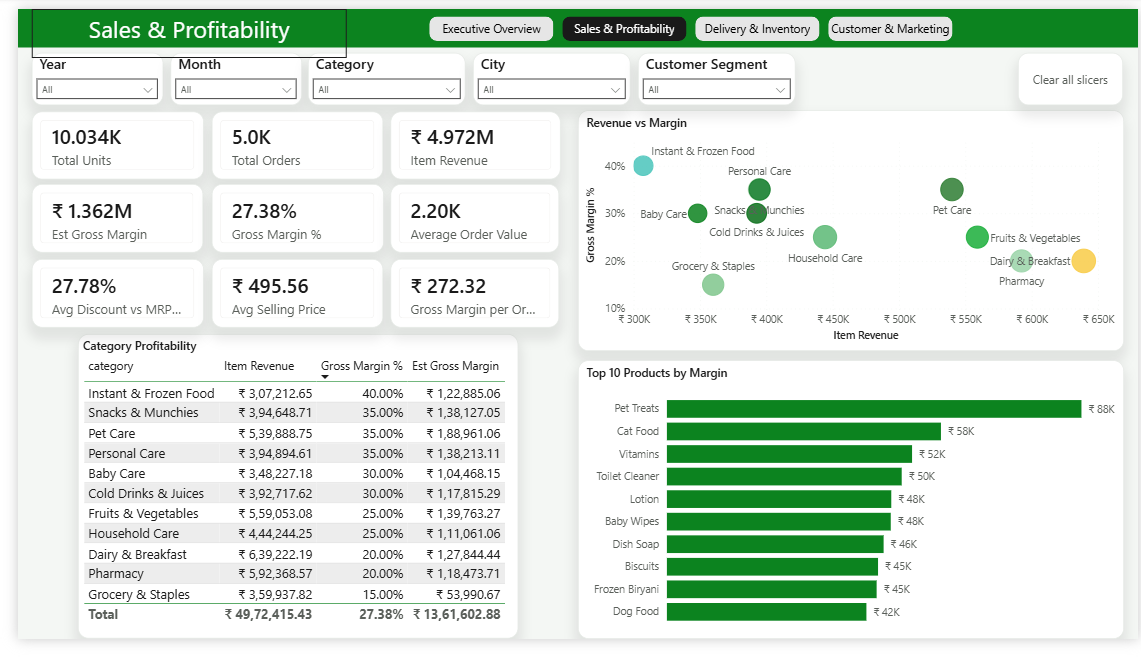
Sales & Profitability. Nine unit-economics KPIs, a revenue-versus-margin quadrant scatter that sorts categories into ones worth protecting, fixing, or growing, and a margin table with conditional formatting.
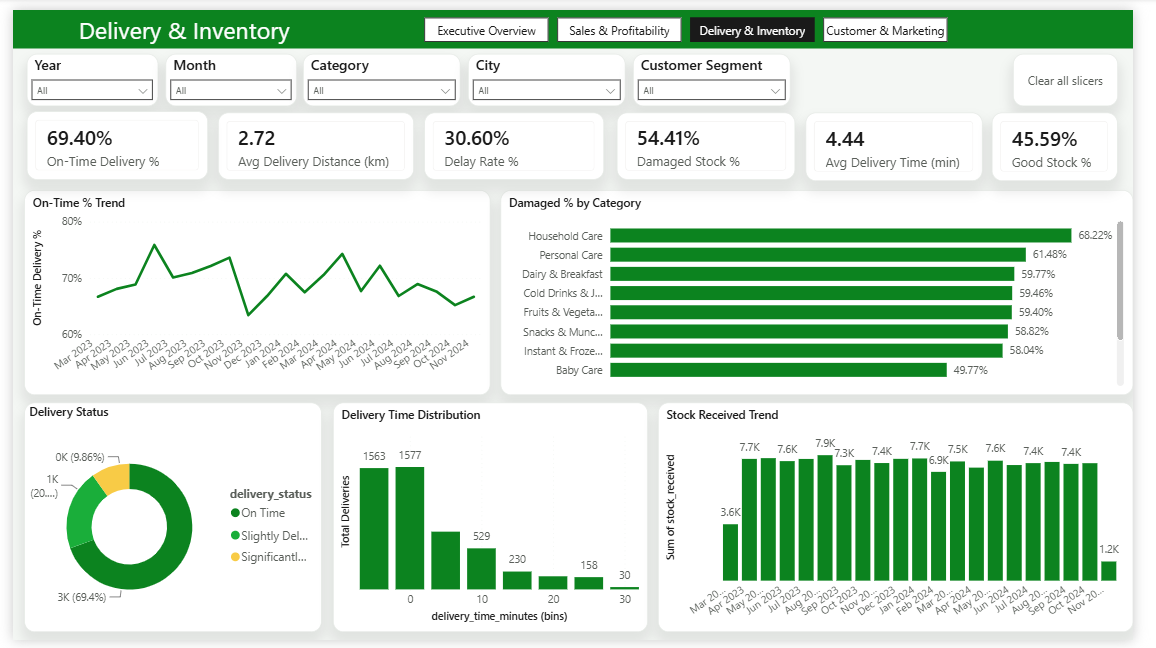
Delivery & Inventory. SLA metrics, an on-time delivery trend, a delivery-time histogram in 5-minute bins, damaged-stock percentage by category, and stock trends over time.
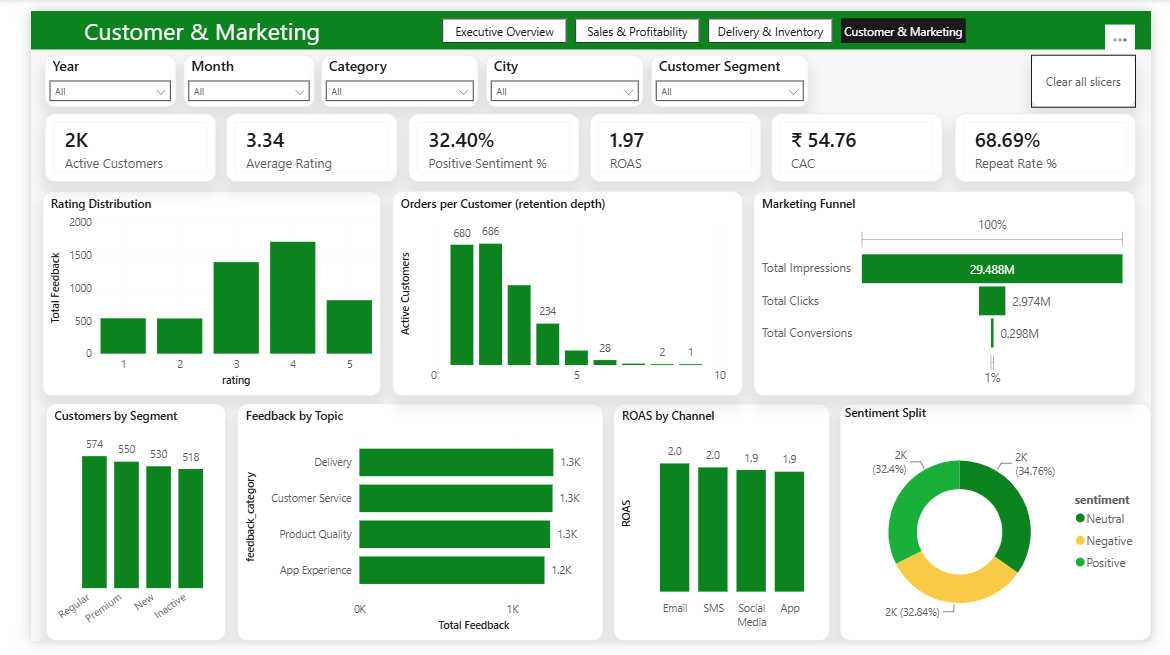
Customer & Marketing. A retention histogram, rating and sentiment analysis, customer segment breakdown, and a marketing funnel from impressions down to conversions, with ROAS by channel.
Data quality decisions that mattered
The dataset looks clean at a glance, but a few checks caught things that would have made the report actively misleading if I had skipped them.
Order-level revenue and item-level revenue do not agree. I expected the sum of item prices in an order to match the order's total, and it does not. The correlation between the two is close to zero. Rather than pick one and hide the discrepancy, I built two separate revenue measures and labeled the category-level breakdowns as item-level analysis, so nobody reads a number as more precise than it is.
Damaged stock exceeded received stock in 39% of rows. That is not possible in a real warehouse, which means it is a data generation quirk, not a business fact. I documented the caveat and excluded it from the headline metrics instead of quietly averaging over it.
Revenue is nearly flat month to month, coefficient of variation around 5.5%. A dataset like that cannot support a growth story, so I re-scoped that part of the analysis to composition (which categories and cities make up revenue) instead of forcing a trend narrative the data does not support.
Top-N city rankings were full of ties. Several cities land on close to identical order counts, so a plain rank by orders kept reshuffling on rounding. I added a small composite tiebreaker, order count plus a tiny fraction of revenue, so the ranking is stable without changing what it means.
One relationship decision worth calling out: the Date table has an active relationship to order_date for day-to-day reporting, and a separate, inactive relationship to registration_date for customer acquisition trends, activated with USERELATIONSHIP only where needed. Keeping one of them inactive avoids ambiguous filter paths across the model.
Where it stands
The report lands on real, checkable numbers: about 11 million in revenue, 69.4% on-time delivery, a 68.7% repeat rate, 27.4% gross margin, and a 1.97x return on ad spend. The repository has the .pbix file, the DAX measure dictionary, and the Python notebook I used to profile the raw data before any of it reached Power BI.
Bhuvan Desai
Applied AI & Data Science @ IIT Jodhpur · SIH 2025 National Finalist
Second-year B.S. Applied AI & Data Science student at IIT Jodhpur, focused on AI/ML, data science, and backend development. I build real projects end to end — from fine-tuned language models and agentic AI systems to production backends. Currently looking for an AI/ML or Data Science internship in Bengaluru.